The dominant narrative promoted by a section of ethno-centric activists and intellectuals is that Nepali civil service is dominated by Hill Bahun/Kshetri and that the Madhesis are excluded and underrepresented.
This is the mixture of lies and half truth. A comprehensive research considering caste, ethnic and gender dimensions of Nepali society shows a different picture. The Nepal Social Inclusion Survey 2012 (NSIS) ranks different caste groups of Nepal on the basis of their representation in government services in proportion to the size of their population.
[Added on 21st December for clarity: the research states, “on the basis of percent of households with access to government jobs”. See Note below for more]
[Additional Note on 22nd December: The second picture below is a ranking based on representation compared to the size of population. The table is from the same study. The first chart is based on percent of households.]
Three high-caste Madhesi groups are at the top of this list.

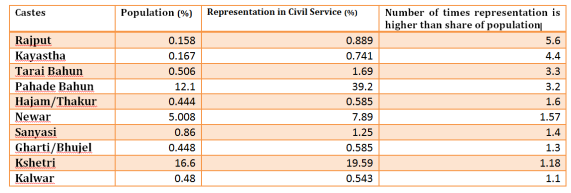
Top 10 ethnic groups over-represented in Nepali civil service when compared to their share of population. Madhesi groups rank at the top. Picture source: Setopati [Picture added on 22nd December].
The study reveals that some Madhesi communities: Rajput, Kayastha and Tarai Bahun have more representation in Government jobs than their share of population and are among the top seven most represented population groups of Nepal. Among the top seven ethnic communities, only two are Hill (Pahadi) communities. The remaining are Madhesi groups.
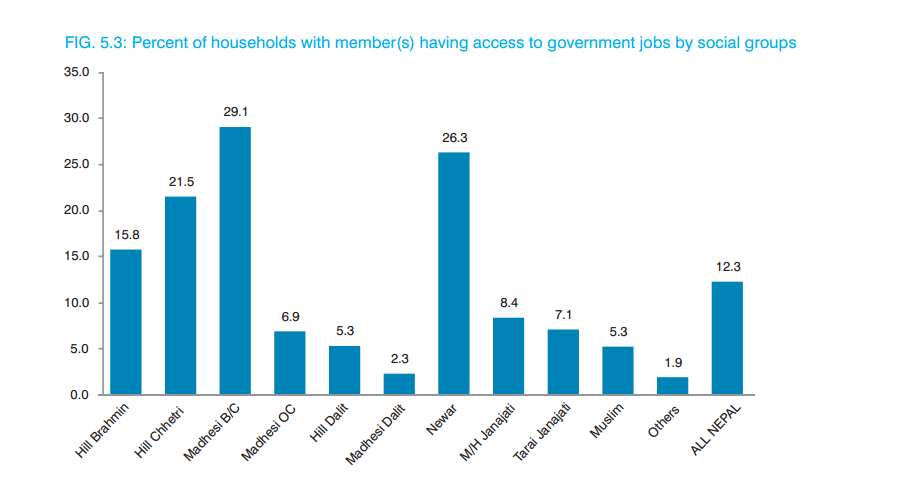
“The Madhesi B/C [Bahun/Kshetri] has the highest percentage (29.1%) in government jobs, which is followed by the Newar (26.3%), Hill Chhetri (21.5%) and Hill Brahmin (15.8%).” The findings of the multidimensional study state, “Dalits, including Madhesi and other caste groups, are well below the average.”
[Related: The findings of the report were also published in Nepali in Setopati.निजामती सेवामा सबैभन्दा बढी प्रतिनिधित्व राजपूत, कायस्थ र तराई ब्राम्हण]
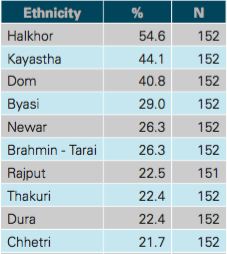
The study very specifically points out that Halkhor and Dom, two other Madhesi groups (ranked at positions 1 and 3), are mostly involved in public services of a low level (cleaning jobs). This suggests that other groups at the top level, including the Madhesi groups like Kayastha, Terai Brahmin, and Rajput do not share such characteristic.
It is important to remember that Madhesi (representing 20% of Nepal’s population) is not a single homogeneous population group. There are huge disparities within different Madhesi communities and their levels of progress. Several Madhesi groups (like Dalits) are among the most backward and disadvantaged in Nepal. At the same time, several other Madhesi groups (like Madhesi Brahmins, Kayasthas, Rajputs) are ahead of all other ethnic groups in Nepal in terms of Human Development Index (HDI), education, wealth, access to government services and opportunities.
[Related: Debunking Dr. Karan Sinsh’s misinformed comments on Nepal in the Indian Parliament]
The study reports that Hill Dalits, which is a broad group, are in the lowest position and Muslims only slightly above them.
NSIS shows that there is no domination of a single caste in Nepali civil service. Out of 98 individual caste groups covered by the survey, 20 castes have more representation in civil service than their shares of population.
According to the study, “Government jobs” covers employment by the government at both the national and local levels, according to the survey. “At the local level, it covers jobs in VDCs, municipalities, DDCs and other government line agencies. However, the level of job is not specified, therefore, including all levels from sweepers to officers.”
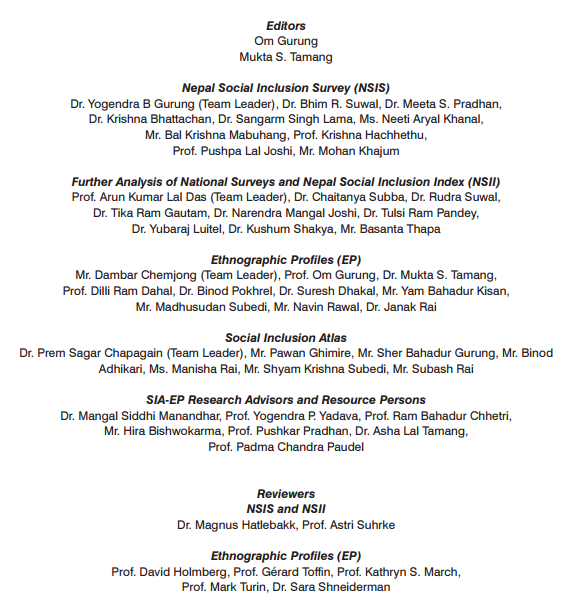
It is important to understand whether there is inclusion in government employment, because it is one of the pertinent institutions for governance, the survey states. The study was carried out by Central Department of Sociology/Anthropology of Tribhuvan University and published in March 2014. It was funded by the Royal Norwegian Embassy (RNE) in Nepal through Social Inclusion Research Fund (SIRF)/SNV. The list of people who led the study can be seen in the picture below.
Note (Added 21st Dec 2015):
The study cited in this post is based on the number of households having access to government jobs. Our initial post missed this detail. All questions regarding the study and methodology should be directed to the concerned research teams. For more clarity, we are adding some statistics of some ethnic groups below.
According to the Population Census of Nepal 2011, average household sizes for some ethnic groups are:
Kayastha 5.1, Madhesi Brahman 5.1, Rajput 4.1, Thakuri 4.9, Newar 4.5, Chhetree 4.7, Hill Brahmin 4.2.
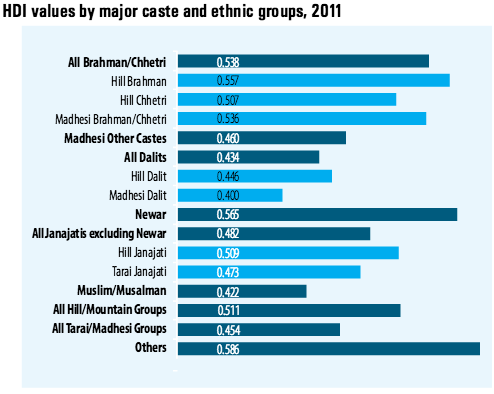
The Human Development Index (HDI) values (published by UNDP) for some ethnic groups are: Hill Brahman 0.557, Hill Chhetri 0.507, Madhesi Brahman/Chhetri (includes Rajput and Kayastha) 0.536, Madhesi Other Castes 0.460, Newar 0.565. The chart is included below for reference.

Comments
56 responses to “#Nepal: Madhesi groups have the highest representation in government jobs”
[…] Source: #Nepal: Madhesi groups have the highest representation in government jobs […]
Important to note: the margin of error is 10 percent, as the sample size is low. The study itself states this fact:
“The sample size was determined to be 152 for each caste/ethnic
group. It is a relatively smaller sample with 10 percent error margin.”
http://www.siaep.org/uploads/resourceDoc/6208_d41d8cd98f00b204e9800998ecf8427e_1400561164_N.pdf#page=30
NOTE: The margin of error is 10% because the sample size is only 152. The study itself states this:
“The sample size was determined to be 152 for each caste/ethnic group. It is a relatively smaller sample with 10 percent error margin.”
http://www.siaep.org/uploads/resourceDoc/6208_d41d8cd98f00b204e9800998ecf8427e_1400561164_N.pdf#page=30
Robert, you seem to know how to read math, but not how to understand and interpret it. Consider the margin or error applies on two very extreme ways, it reduces Kayastha’s number by 10% and increases Hill Chhetri’s number by 10%- even at such an extreme case, Kayastha group is still ahead of Hill Chhetri.
Another point. The population of Kayastha is smaller than that of Hill Chhetri. So the margin of error will be smaller for Kayastha thanf or Hill Chhetri if same number of samples were used for both groups. This means that the numbers of Terai groups will have lower margin of error than the larger population groups Hill Brahmin Chhetri. Newar has a relatively small population group, but that group also has a lower representation.
Nirmal, I have merely quoted the study’s own remark on margin of error. So there is no basis for you to criticize my math abilities.
https://blog.com.np/2015/12/20/nepal-madhes-most-represented-government-jobs-civilNirmal wrote:
> Robert, you seem to know how to read math, but not how to understand and interpret it.
> The population of Kayastha is smaller than that of Hill Chhetri. So the margin of error will be smaller for Kayastha than for Hill Chhetri if same number of samples were used for both groups.
Nirmal, if you calculate the margin of error for Kayastha and Chhetri, you will find they are essentially the same.
Population:
Kayastha: 44,304
Chhetri: 4,398,053
Margin of Error with sample size of 152 (99% confidence):
Kayastha: 10.43%
Chhetri: 10.45%
Even though the Chhetri group is 100 times the size of Kayastha, the difference in the margin of error is close to zero. This may seem counter-intuitive, but that is how the math works.
You can calculate the margins of error yourself with this tool:
https://www.checkmarket.com/market-research-resources/sample-size-calculator/
Census figures:
https://web.archive.org/web/20130418041642/http://cbs.gov.np:80/wp-content/uploads/2012/11/National%20Report.pdf#page=156
I actually should have divided each group population by the average household size in the above calculation. However, it has almost no effect on the margins of error; the point is the same.
Bad interpretation of Good data.
Madheshi Brahmin/Rajput/Kayastha make up only about 5% of the total Madheshi population (Madheshi population is about 33% of the total national population)
While Bahun/Chhetri make up 50% of the total hilly population (Bahun/Chhetri population is about 33% of the total national population)
So, in other words the data & maps contained in the above article could be better summarized as – “Only about 5% of the Madheshis have better representation in government jobs, compared to 50% of the hilly people”
The author displays a mathematical misunderstanding by making this comparison: “The study reveals that some Madhesi communities: Rajput, Kayastha and Tarai Bahun have more representation in Government jobs than their share of population.” He confuses % of ethnic representation of individuals vs. % of ethnic households. These are different stats and cannot be compared.
To illustrate, suppose we ask these questions:
What % of the population are women? About 50%.
What % of households have women? Much more, maybe 90%.
So it’s meaningless to compare these two kinds of statistics.
Similarly, the % of Madhesi households with one or more government staff cannot be compared to the Madhesi % of the population.
Your inability to properly read all the facts presented is indeed sad for someone who has so much time and skill to scour blogs to troll with comments.
Did you read the Setopati article? This article is referring to two things. First, when compared to the proportion of their population, which ethnic group are represented more in the civil service? The answer is: some Madhesi groups.
The second thing is. When comparing the percent of households of each ethnic group, which ethnic group has the highest percent of households with access to government jobs? The answer is again: some Madhesi groups.
This is not an isloated or strange fact. Even the UN’s HDI figures show that some Madhesi groups are very high up. So much coincidence and consensus among different figures published by several Nepali, foreign and academic sources if it were false, as you are claiming.
Another issue: household size is large for Madhesis but smaller for Mountain and Hill people. The study is careful to point this out:
“Household size is relatively large among Madhesi and Madhesi
Other Caste (OC) groups and smaller among Mountain and Hill groups.”
http://www.siaep.org/uploads/resourceDoc/6208_d41d8cd98f00b204e9800998ecf8427e_1400561164_N.pdf#page=30
Household size varies greatly in the group averages, from 4.6 to 7.4 people per home. These have the largest households on average:
Lodha 7.4
Kewat 7.4
Kahar 7.3
Muslim 7.3
Kanu 7.3
Whereas these groups have the smallest households:
Lepcha 4.8
Thakali 4.7
Sherpa 4.7
Koche 4.6
Panjabi/Sikh 4.6
Thus, statistics based on these varying household sizes cannot be simply compared to percentages in the overall population.
Bigger the Household size means there is higher chance of having more than one government worker in same household. Madheshi people have advantage here.
To understand the effect of household size on representation %, consider this example:
Suppose two groups of 100 people each have 1 government worker. Each worker will belong to 1 household. If the groups are Lodha and Sherpa, the average households have 7.4 and 4.7 people, respectively.
Thus, it can look like “only 4.7” of the Sherpa group have representation in government, while 7.4 of the Lodhas are represented.
But remember, each group of 100 has just 1 government worker, in this scenario. The actual representation is 1% for both!
Your inability to properly read all the facts presented is indeed sad for someone who has so much time and skill to scour blogs to troll with comments.
The size of households you are pointing to has no relevance to this post. The blog has mentioned (at the bottom) the sizes of households for the groups discussed at the beginning. The size of population of Madhesi groups like Kayastha, Rajput and Madhesi Brahmin is smaller than that of Hill Brahmin Chhetri. So, the margin of error is very less for those Madhesi groups. This is what my previous comment states.
The size of households for these Madhesi groups and the Hill groups discussed in the article is not very big. Your intention seems very maliced as you are using household sizes of groups not even discussed in this blog to twist the argument.
See my previous comments too.
Nirmal, you keep making vague claims about margins of error. Why don’t you calculate these margins of error and post them, as I have?
Madhesis were only 8% of the government officers in 2012. And this is a drop from 2006, when they were 9.9% of officers:
http://www.moga.gov.np/main/images/pdf/Inclusion%20in%20Civil%20Service%20-%20Issues%20and%20Initiatives.pdf#page=24
This is a clearer measure of representation in government jobs. These numbers are a census of all civil officers. There is no sample and thus no margin of error. The absolute numbers are found here:
http://www.cedepnepal.com.npwww.cedepnepal.com.np/web_resources/files/201503011219056076.pdf#page=49
And measuring civil officers removes the issue of including low-level jobs like cleaning, as acknowledged in this article.
So it means the “revolutionary governments” after 2006 were not able to raise inclusion than the “regressive governments” before them? What a failure for the much touted “progressive” programs and political parties ruling the government durint 2006-2015 (many Madhesi parties included).
Also, among the 8% Madhesi, I am pretty sure a large majority belongs to Madhesi high-caste groups like Brahmin, Rajput and Kayasthas. They have a much higher presence than any other group. In contrast, other Madhesi groups have been deprived of the opportunities. The reservation quotas are meant for all Madhesis, while some are much more in the need of such policies than others.
So this does nothing to the argument in this blog, that some Madhesi groups are much ahead than any other groups in the country, while others are much far behind. Mixing them together is detrimental to the overall goal of inclusion. Also, 8% presence is not too bad for Madhesi groups whose population share is somewhere between 15-20% in Nepal.
You are trolling with irrelevant comments.
Nirmal, I proved you wrong mathematically, after you claimed I didn’t know “how to understand and interpret math.” You claimed “the margin of error will be smaller for Kayastha than for Hill Chhetri,” but I actually calculated the margins of error and proved there was no significant difference. But instead of admitting you misunderstood the math, now you switch to other deflection tactics.
No you haven’t proved me wrong. The margin of error is smaller, as I said. I never gave any mathematical formula or significance test. You are only trolling with your irrelevant and misleading comments. You are considering 99% confidence level which will naturally have a smaller difference. Reduce that to 90% or 95%, as in normal statistical studies, the difference will be bigger. Don’t you know this, or are do you have some maliceful malice?
It is simple math. If same sample size is used for a large and small populations, the margin-of-error will be smaller for the smaller population. Go check any math textbook.
Nirmal, 99% is also a common confidence level in studies.
https://learn.bu.edu/bbcswebdav/pid-826908-dt-content-rid-2073693_1/courses/13sprgmetcj702_ol/week03/metcj702_W03S02T08a_determining.html
I have calculated the margins of error using 99% confidence level as well, though I haven’t posted them. Why don’t you do the calculation yourself and report how big the difference is between the margins of error?
Robert, I don’t know what your intention is, but they don’t look good.
Popular surveys like Nielsen TV rating surveys also work with a 10% margin of error. Or even higher.
Even with that margin of error, the blog’s conclusions do not change. There are other numbers, like the UN’s HDI, Nepal’s own census, which are some external validation of the claims. What claims do you have? What studies have you done? You seem to be marginally aware of Nepali society form your comments, which I have already pointed out.
This study has polled many ethnic groups, so 152 households per ethnic group (about 125 of them) were sampled randomly from all over the country. That’s not a small study at all. It involves tens of thousands of people from all over Nepal. And you are rejecting the study because of what reason exactly? Because it does not conform with your biases? Ok, thank you very much. But that doesn’t change the conclusions presented in this post.
Nirmal, I never said that I reject the study. I mentioned that the margin of error is 10%, but did not say this is a fatal flaw. Somehow, my quoting the study’s statement on its margin of error resulted in you saying I don’t know how to “understand and interpret math.”
What I actually criticized was UWB’s bogus comparison of percent of households to percent of general population. This was mathematically wrong, and they admitted as much by adding several notes to “clarify”, i.e. backpedal.
You are again wrong. The comparison is not bogus. UWB is saying two things, both quoted form the study. First, comparing the percent of households that have access to government jobs, some Madhesi groups are rank higher than all others. Second, comparing the representation in government jobs compared to the proportion of population, some Madhesi groups rank higher than others. Both statements are true. They have given charts and numbers to quantify both. I don’t see anything mathematically wrong.
You have made me repeat this time and again. Your inability to properly read all the facts presented is indeed sad and symptomatic of trolling.
Tell me again, what is your basis for calling it bogus? What is your problem exactly?
I don’t know about the authors, but as far as I can see, they haven’t changed their claims, and if you look at the cited research, their claims have remained true from the beginning to now. Are you saying they can’t add clarifications or additional facts to help readers like yourself who seem to have poor understanding of maths or the Nepali society?
Nirmal, I have already explained multiple mathematical problems with comparing percent of households with percent of individuals in the population, in other comments.
Nirmal, you continuously claim I don’t understand math, yet you still have not calculated and posted margins of error as I have challenged you, and I have done myself.
Robert, that’s where the problem is- you don’t understand but you pretend to and then go ahead to make tall claims.
This is talking about two separate things- do you not understand this simple fact? There are two reports of this study. One publishes the percent of households with access to government jobs. The other publishes the representation in government jobs based on the proportion of population. In both counts, Madhesi groups are ahead of others.
What part of this simple English explanation is hard for you to get?
Now, please apologize for wasting my time, accusing me for making “vague claims”, and all the your other non nonsensical claims and comparisons.
Robert,
I hoped you already knew some introductory Statistics or knew how to find a book and study. I did not see any purpose in repeating what’s so widely known and available for anybody who’d have the humility and patience to learn.
Here are some calculations for margins of errors for you. I am not going to print formulas and derive the proofs for you, mainly because my time for teaching you math is not free, but also formatting here would be painful. Please note that I might have made errors in calculations, please feel free to check and correct me. But without making accusations, and understanding that errors are possible, and humane.
There are several assumptions that go into this- including the underlying distribution, and response distribution. But here are two populations, two samples:
A: population size 200, B: population size 2000.
If you want a confidence level of 90%, the following sample sizes will give you the respective error margins:
For population A:
sample size of 50 would give 10% margin of error,
sample size of 100 would give about 6% margin of error,
sample size of 120 would give about 4.8% margin of error,
sample size of 140 would give about 3.8% margin of error.
For population B:
sample size of 50 would give about 11.5% margin of error,
sample size of 66 would give 10% margin of error,
sample size of 100 would give about 8% margin of error,
sample size of 120 would give about 7.3% margin of error,
sample size of 140 would give about 6.7% margin of error.
From the above numbers, you can see that the same sample size would give different margins of errors for different population. In general, the same sample size would give higher margin of error for bigger population. How high would this margin of error be? The relationship is not linear- the margin of error grows much slow than the sample size. That’s why studies settle for standard margins of errors and confidence intervals and use the sample needed. For higher precision, the required number of samples would be prohibitively large to conduct the study.
Robert dismissed the study because of what? Because the sample sizes were small? Because the margin of error was 10%? Those are how many standard studies are conducted.
Now, please apologize for wasting my time, accusing me for making “vague claims”, and all the your other non nonsensical claims and comparisons.
I meant to write: “I have calculated the margins of error using 95% confidence level as well.”
Nirmal, when you say “8% presence is not too bad for Madhesi groups,” I don’t know how to respond.
You should have knowledge of History of Nepal. Madheshi people were better represented in past, it is truth. Hilly areas dont have good records in education history. Madheshi people were in advantage, closer to indian border. Actually, condition of most madheshi communities are improved. In past ,majority of educated people in Nepal belonged to high caste madheshi people who had opportunities of getting Education in India but Now Hill high castes have greatly overpowered them due to huge population. But condition of average madheshi high caste is still far better than average pahadiya high caste.
Madhesis are only 1.3% of Armed Police Force, and 6% of Nepal Army:
http://www.cedepnepal.com.npwww.cedepnepal.com.np/web_resources/files/201503011219056076.pdf#page=52
This is another crucial measure of inclusion. It’s very clear, with no margin of error from sampling.
Do you know that the richest people in Nepal come from Madhesi groups? The richest person is a Madhesi. Many big business houses are run by Madhesi origin people. They get majority of bank loans and have much higher access to financial institutions and loans. They are also one of the leading land-owning groups in Nepal. If you compare the number of people in army, I think even Newars and Hill Brahmin would have very less representation.
Top Madhesi groups, who are successful in business, would have little incentive to join the army. Has there been any attempt, or policy in the democratic Nepal to bar any ethnic group from joining the army?
You do not seem to understand Nepali society at all.
Yes, some Madhesis are rich. The vast majority are not rich. What does this have to do with Madhesis being extremely under-represented in the army (only 6%)?
dont mix marwaris and NRN with nepalese madhesis
Please read History of ten years about Nepali Army. And Tharu people are better represented than limbu people. How many madheshi people wish to join Nepal army ?
Robert,
When you say “Madhesis”, are you talking about the high-caste Madhesis or the “untouchable” Dalit Madhesis?
Please be clear on that because that understanding and distinction is crucial to understand what has been posted by the blogger above based on the survey.
Given so much inequality (economic, social as well as political/representational— highlighted by the same survey cited above) that exists among various Madhesi groups one can not and should not club them all together. Doing so would be injustice especially to the ones that are severely underrepresented and marginalized at the cost of those who are over represented in the state bodies (proportional to their population).
Why that is important? It is because the quota system that is provisioned by the inclusion law passed after the 2006 janaandolan clubs the Madhesi Bahuns and the Madhesi Dalits in the same category as Madhesi. This has defeated the purpose of the law which was to include the excluded groups in the state machinery, not to increase the share of those who were already over-represented (in proportion to their population).
Prateet, studies have their own definitions of “Madhesi.” I usually discuss their findings on their terms.
I agree with your concern for Madhesi Dalits. Consider this: only 8% of government officers are Madhesis in general. This is obviously much lower than the Madhesi population in general.
So then, how much lower is the representation of marginalized groups within Madhesis? If a privileged few Madhesis are over-represented in this 8%, does that not indicate most Madhesis are under-privileged and under-represented?
Bharat Shah commented that “Madheshi Brahmin/Rajput/Kayastha make up only about 5% of the total Madheshi population.” In that case, 95% of Madhesis would be under-represented. For them, the situation is EVEN WORSE than the 8% of civil officers being Madhesis in general.
http://www.moga.gov.np/main/images/pdf/Inclusion%20in%20Civil%20Service%20-%20Issues%20and%20Initiatives.pdf#page=24
Robert,
You didn’t answer my question. You ducked it. I will wait for your answer.
That’s because that’s critical to this whole debate.
There is an urgent need to differentiate between the privileged and the marginalized. If you bracket them together and demand the rights for the whole, you will be doing injustice to most marginalized and the mistreated ones and you will be encouraging the inclusion of those who are already over represented at the cost of those who are yet to be included. The Dalits, generally in Nepal but particularly in Tarai, have been treated extremely unfairly and excluded- historically- by both the state and the high-caste peoples in both Tarai and Hill regions.
While, thanks to the Maoist movement, the way Dalits are treated in the hills by the high caste (and not just Bahuns and Chhetris but the Janajatis too) and the State has seen some positive changes, that’s not the case in the Tarai even after multiple political movements and many changes since 1990 and more specifically after 2006. Anectdotal evidence and personal observations suggest the gap and inequality between the Dalits and the high-caste/janajatis in the hills has decreased, Dalits are less fearful to assert their rights and to stand up to the mistreatment and bullying. But the same is not the case in Tarai where Dalits are the poorest citizens of Nepal. They continue to be ignored by the State and, equally concerning if not more, exploited by the high-caste Madhesis. The fact that some of the richest people in Nepal are from Tarai just highlights this unacceptable inequality. To make matter worse for the Madhesi Dalits, these riches people/caste groups are also called Madhesis and, in fact, lead and dominate the Madhes movements and almost all Madhes-based parties.
Now, you bring out the number of 8%. I am all for that number to increase and I am hopeful that the continued implementation of the inclusion law will make that a reality in the next decade or so. BUT only if there is reform in the inclusion law, the Madhesi inclusion in the government will be inclusive in itself. If not, and if the Madhesi quotas are eaten up by the already over represented and privileged high-caste Madhesis, the Dalits will continue to be excluded. If this exclusion, in the name of inclusion, is not addressed, problems will remain in Tarai– regardless of any political settlement that the government signs with the protesting parties. Therefore, it is urgently required that the over represented Madhesi groups are removed from the quotas (just like mainstream Hill Brahmins and Chhetris are excluded) and let the Dalits go into officer-level positions in the government machinary.
By highlighting the fact that some Madhesi groups have highest representation in the government jobs, this blog post contributes to this much needed debate.
Prateet, I did indeed answer your question. Whenever I present statistical facts about Madhesis, I quote figures from studies which define what “Madhesi” means in their research.
Brahman\Rajput\kayastha\kalwar have only 0.8% of population Share. They and some other madheshi communities dont need Madheshi quota at all. Why dont you speak on that ?
Nirmal – why must you add personal remarks against Robert at the end of your comments? This is a good debate, respond to his statements, not to him personally using emotions.
Biggest problem with us Nepalis-we think with our egos.
Thapa, you are heavy on assumptions. How are you assuming I am a Nepali, and how are you assuming you know about what;s the problem with all Nepalis? I have responded to all his questions. he hasn’t responded to mine. Even if you consider the worst case error that Kayastha is 10% worse off and Chhetri is 10% better off, the conclusion of this post still is true.
then Mr. Penner goes ahead and presents irrelevant numbers like the household size of some group not even discussed in this post and other completely irrelevant things. That’s called trolling, and his intention look full of malice. This is not anything personal. This is clearly based on his activities and comments, not about who or what he is.
Did you just learn something about how to think without ego and generalizing full of assumptions?
Nirmal, you claim you responded to all my questions, but you have not. I asked you to calculate margins of error to back up your vague claims.
Robert, the world does not run by your whims. Your “asking” to do something of someone should not necessarily translate to that person “obliging” to you.
But to give your arrogance a taste of its own medicine, I have replied in one of the comments above the calculations for margins of errors. Something one could easily find in standard textbook, or by humbly consulting people who seem to know such things. It has already been a day since I posted that comment, but you have nor replied. Nor have you apologized.
Let me be slightly off-topic for a moment here, although many people reading the comments in this blog would find it very on-topic: Have you always gotten by with your sense of “I having the right to trot around with my arrogance and get what I need” ? Fixing it might be a good idea.
there is inequality in kayastha too. only some kayastha are over represented ,majority of kayastha are poor. I am a nepalese kayastha and i was not sample surveyed/
Same for pahadioya Brahmin. What do you think ???
Ok, fine. All I’m saying is you didn’t need to add emotions in your response – it just makes you look like a loser in this debate although you think your defending the study results quite well.
[…] [Related: Nepal: Madhesi groups have the highest representation in government jobs.] […]
This video might be relevant.
Here’s what the breakdown of a select number executive bodies of Nepal look like.
http://www.dorjegurung.com/blog/2015/11/there-is-poor-representation-and-then-there-is-nepal/
[…] [Related: Nepal- Madhesi groups have the highest representation in government jobs] […]
[…] [Related: #Nepal: Madhesi groups have the highest representation in government jobs] […]
[…] Read: Madhesi Groups Have the Highest Representation in Government Jobs […]
I donot on what basis this article was written .Every groups of madhesi are not equally employed.
Promod Blogs -Blogger from Nepal
I donot on what basis this article was written .Every groups of madhesi are not equally employed.
IOE Notes-All Engineering Notes